When a Routine Argo CD Upgrade Slowed Everything Down
A routine Argo CD upgrade brought our deployment pipeline to a crawl. Here's how I tracked down the performance regression, uncovered an unexpected bottleneck, and fixed it upstream.
Argo CD was doing its job: applications were syncing successfully. Yet after we upgraded from version 3.3 to 3.4, our deployment pipeline became noticeably slower. Deployment status notifications arrived late, and the deployment tool kept waiting long after synchronization had completed.
Something else was odd: the Argo CD notifications controller was using considerably more CPU than before. It wasn’t immediately clear how the higher CPU usage was connected to the delayed notifications, or what had changed between the two versions. What started as a routine upgrade turned into a deep dive into Argo CD’s internals.
This is the story of how I tracked down the regression, fixed it, and contributed the change upstream to Argo CD.
Background: Event-driven deployments with Argo CD
The deployment platform I was working on uses an in-house tool to orchestrate microservice deployments across different environments.
The tool handles deployment requests, updates the desired state in a GitOps repository, triggers Argo CD synchronization, and waits for deployment status events before it reports the outcome to the user.
The workflow looks roughly like this:
- The deployment tool receives a request to deploy a microservice.
- It validates the request and patches the microservice’s values in the GitOps repository.
- It triggers an application sync through the Argo CD API.
- Argo CD reconciles the application against the desired state.
- The Argo CD notifications controller evaluates the application status and sends a webhook.
- The deployment tool receives the event and continues the deployment workflow.
Instead of continuously polling Argo CD for application status, the deployment tool relies on the notifications controller to emit deployment events through a custom webhook.
This makes notification latency an important part of overall deployment performance. Even when an application synchronizes successfully, a delayed notification leaves the deployment tool waiting unnecessarily.
The regression
After the upgrade from Argo CD 3.3 to 3.4, deployment status notifications began to arrive noticeably later than expected.
The delays had a direct impact on deployment throughput. Because the deployment tool waits for status events, even a successfully completed synchronization could hold up the workflow.
The notifications controller was also using more CPU than before. This suggested that the problem might not be in webhook delivery itself.
The next step was to find out where the additional work came from.
Investigation: Following the CPU profile
To investigate the regression, I set up an isolated Argo CD environment where I could reproduce the behavior without interfering with production workloads.
I used Go’s pprof tooling to profile the notifications controller and examine its CPU usage.
The resulting flame graph revealed an unexpected hotspot: about 30% of CPU time was spent in the getAppProjectForTemplate call path, almost all of it inside GetAppProject.
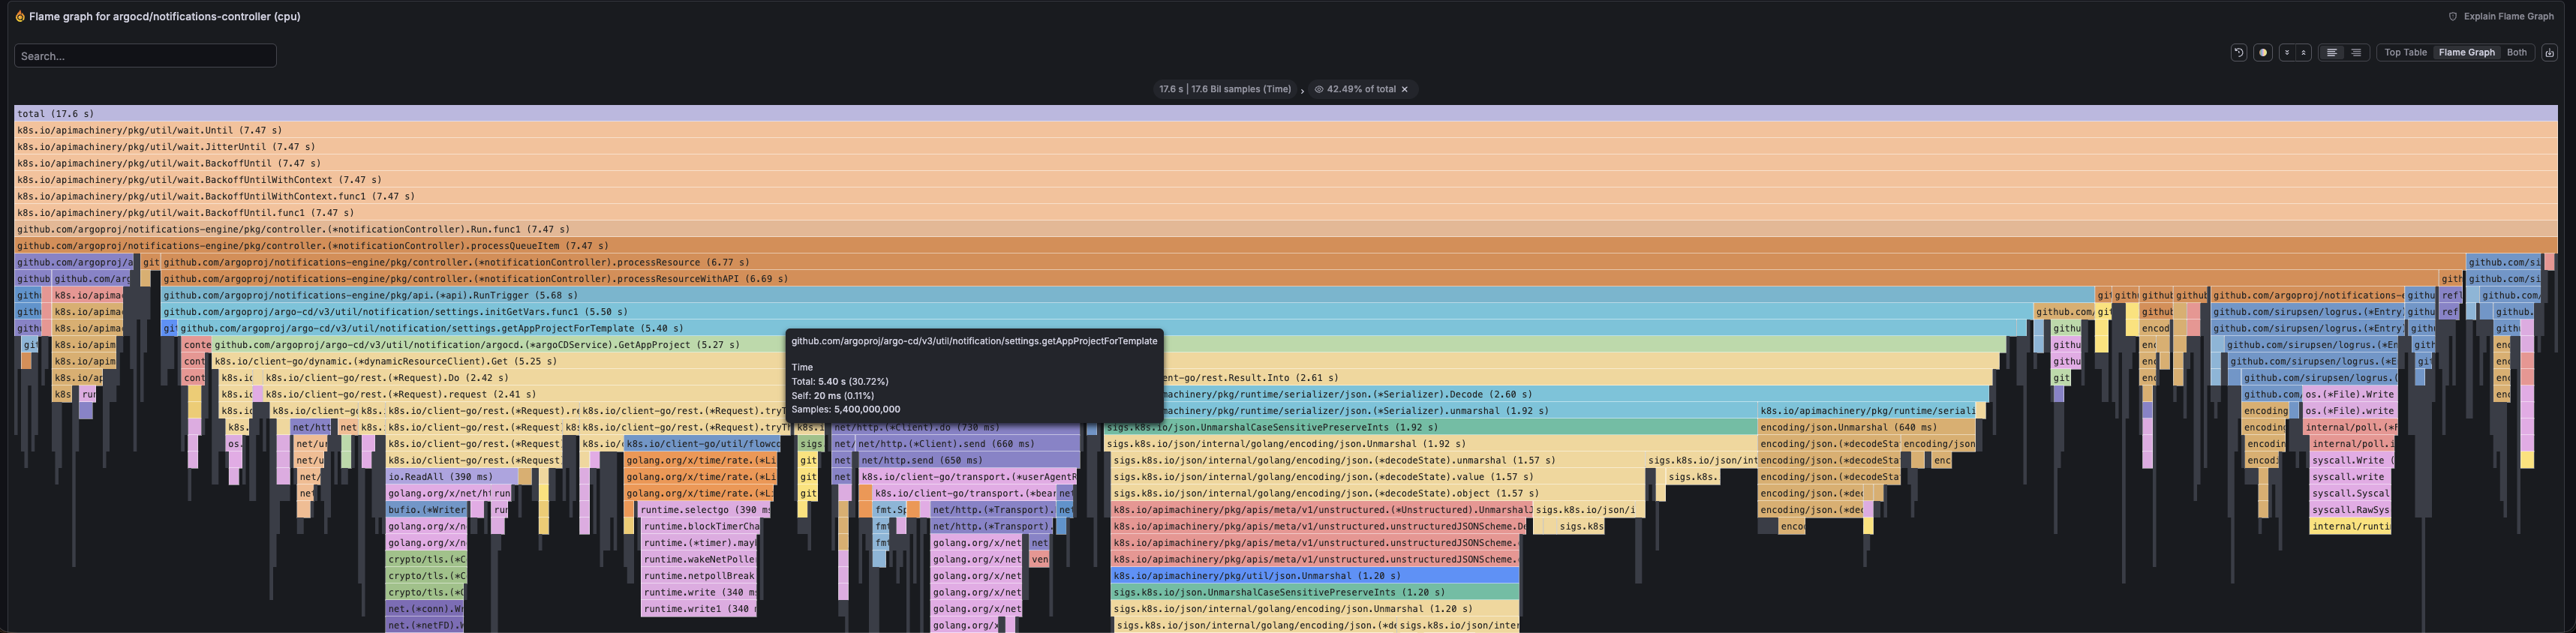
getAppProjectForTemplate takes 30.72% of CPU time (5.40 s of 17.6 s).GetAppProject retrieves an Argo CD AppProject resource, which defines project-level configuration such as permitted repositories, deployment destinations, and access policies.
A closer look at the call path revealed the problem.
During notification trigger evaluation, Argo CD prepares a set of variables that are available to notification templates. One of those variables is appProject, which is populated by getAppProjectForTemplate.
The implementation called GetAppProject to retrieve the corresponding project resource directly from the Kubernetes API server.
The important detail was where this call happened. The lookup ran as part of each trigger evaluation. Because multiple triggers are evaluated for every application, the same AppProject resource could be fetched again and again.
These were synchronous Kubernetes API requests, even though the project data rarely changed. As the number of applications and trigger evaluations grew, so did the number of unnecessary API calls.
The result was additional CPU overhead, network round trips, and load on the Kubernetes API server, all in a frequently executed path of the notifications controller.
The fix: Avoiding unnecessary API calls
Kubernetes controllers commonly use shared informers to maintain a local view of cluster resources.
An informer first lists the relevant resources from the Kubernetes API server and then watches for subsequent changes. These changes are reflected in a local, indexed cache. Instead of making a new API request for every resource lookup, the controller can retrieve the resource directly from memory.
This significantly reduces API server traffic and avoids unnecessary network round trips.
There is a trade-off: an informer cache provides an eventually consistent view of cluster state rather than a fresh API read every time. For many controller operations, this is the intended and appropriate access pattern.
In this case, the notifications controller already had an informer for AppProject resources, but the notification template evaluation path didn’t use it. Instead, it made a live Kubernetes API request through GetAppProject on every evaluation.
The fix was to use the informer-backed cache for these lookups.
There was one additional consideration: the notification settings code is shared between the long-running notifications controller and the argocd admin notifications CLI. Unlike the controller, the CLI doesn’t maintain an informer cache, so it still needs to retrieve an AppProject directly from the Kubernetes API.
The solution therefore had to support both access patterns: informer-backed lookups in the controller and direct API requests where an informer isn’t available.
This removed unnecessary API requests from the controller’s hot path and preserved the behavior of the CLI.
Measuring the improvement
After implementing the change, I deployed the patched notifications controller in the isolated environment and repeated the profiling experiment.
The difference was substantial.
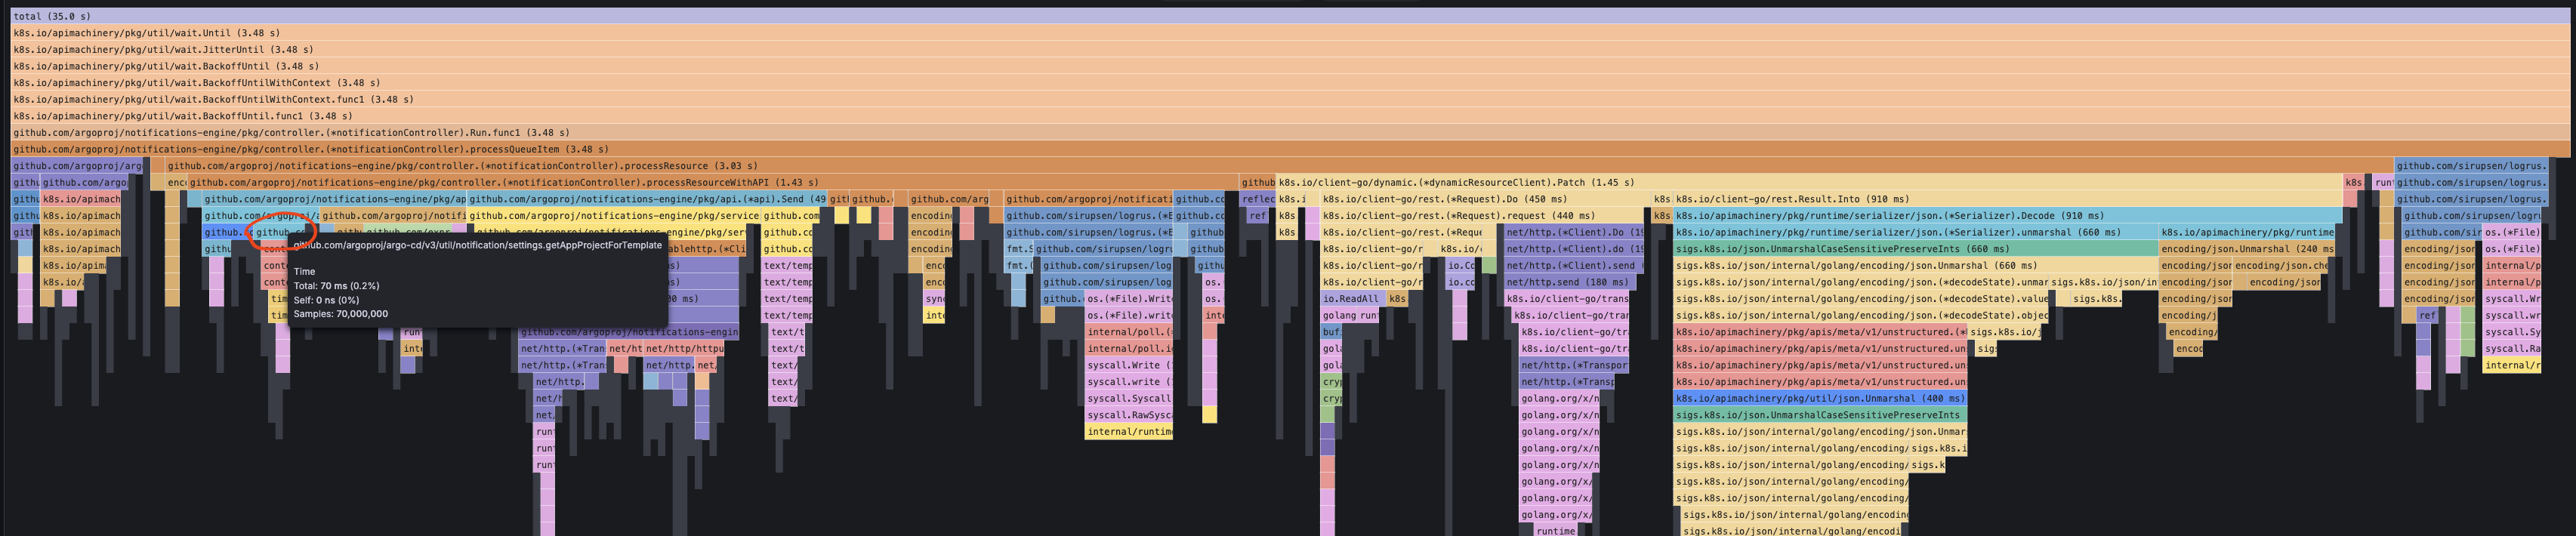
getAppProjectForTemplate takes 0.2% of CPU time (70 ms).In the original profile, approximately 30% of CPU time was spent in the getAppProjectForTemplate call path. With informer-backed lookups, that figure dropped to around 0.2%.
| CPU profile | Before | After |
|---|---|---|
Time spent in getAppProjectForTemplate |
~30% | ~0.2% |
The previously prominent call path had become almost negligible. This confirmed that the repeated Kubernetes API requests were responsible for a substantial part of the observed overhead.
I submitted the fix upstream to Argo CD in PR #28815. It has been merged and backported to the 3.4 and 3.5 release branches.
Lessons learned
This investigation reinforced a few things worth keeping in mind when you develop Kubernetes controllers.
Be careful with Kubernetes API calls in hot paths
A single API request might look inexpensive, especially when the resource is small. But its cost needs to be considered in the context of how frequently the code runs.
A call made once during initialization is very different from one made during every reconciliation or trigger evaluation. Multiplied by hundreds or thousands of resources, an otherwise harmless request can become a significant bottleneck.
Use informer caches whenever appropriate
Kubernetes informers are not just a convenient abstraction. They’re a fundamental part of building efficient controllers.
They let controllers maintain a local view of cluster resources and avoid repeatedly requesting data that is already available.
In this case, the informer was already present. The important part was making sure the frequently executed code path actually used it.
Configure Kubernetes client rate limits
Kubernetes clients provide QPS and burst settings to limit the rate of requests sent to the API server. These limits are useful safeguards, particularly for controllers that operate on large numbers of resources.
However, rate limiting is not a substitute for efficient API access. If a controller makes unnecessary requests, lowering its QPS limit may reduce API server pressure but make the controller even slower.
The better approach is to eliminate unnecessary requests first and use rate limits to protect against excessive traffic.
Profile before optimizing
Without profiling, it would have been tempting to investigate webhook delivery, notification configuration, or other parts of the deployment pipeline.
The CPU profile pointed directly to an expensive call path and gave a clear direction for further investigation. It also provided a way to validate the fix instead of relying on assumptions about the expected improvement.
Conclusion
The interesting part of this regression was how a relatively small implementation detail could affect an entire deployment workflow.
A synchronous Kubernetes API call inside a frequently executed controller path was enough to create substantial overhead. Switching that path to an informer-backed lookup reduced its share of the CPU profile from approximately 30% to 0.2%.
It’s a useful reminder that efficient Kubernetes API access is not just a performance optimization. It’s an important part of designing controllers that stay responsive as the number of applications and events grows.